Demo gallery
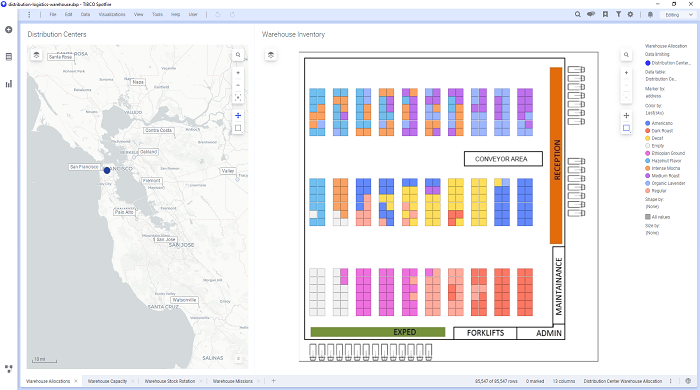
Demo shows a warehouse layout with stock allocations, capacity, and rotation data. Also includes put missions for receiving stock into the warehouse and allocating to storage, and pick missions for sending stock outwards to stores.
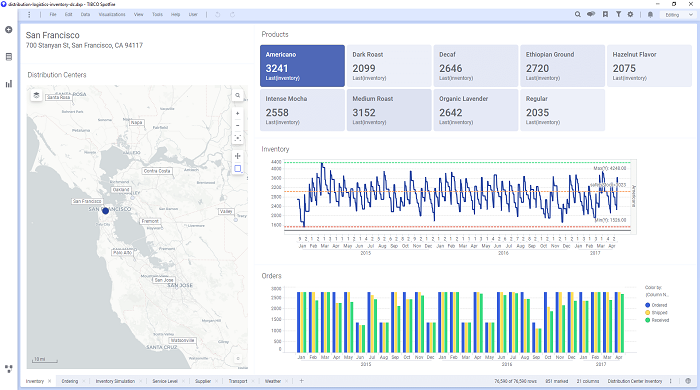
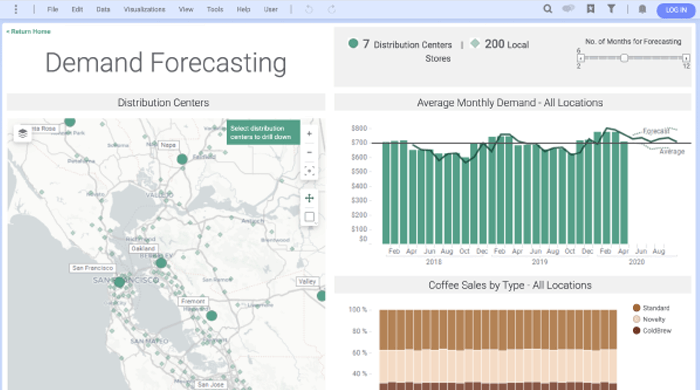
Shows an analysis of inventory levels in distribution centers and stores across a retail environment for a variety of SKUs. Includes modelling of Economic Order Quantity and Safety Stock levels, as well as in Inventory Simulation for promotions.
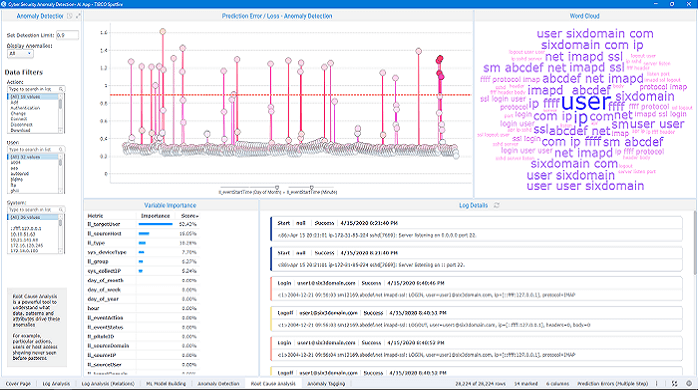
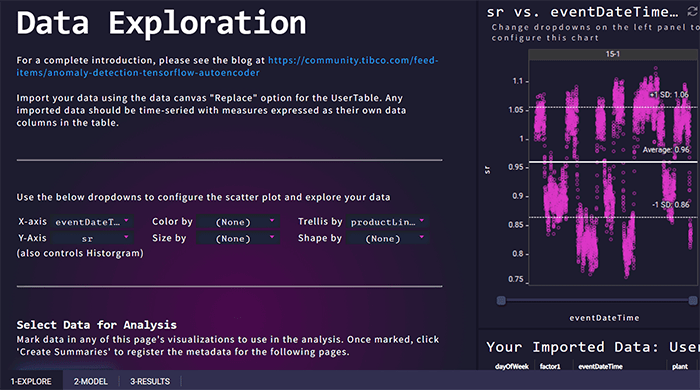
Combine the powers of Python, deep learning models, and data exploration to identify anomalies and detect complex cyber threats in log data.
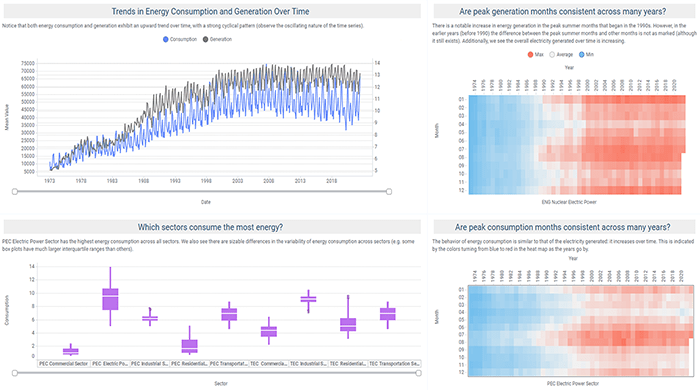
Forecasting energy consumption and generation is critical to energy management and planning. It involves predicting the future demand for energy based on historical data, environmental factors, and other relevant variables.
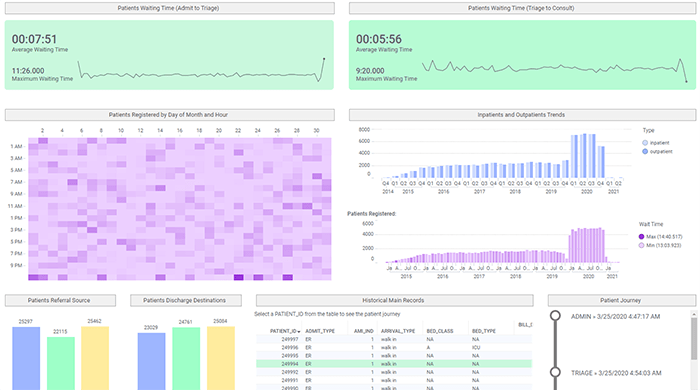
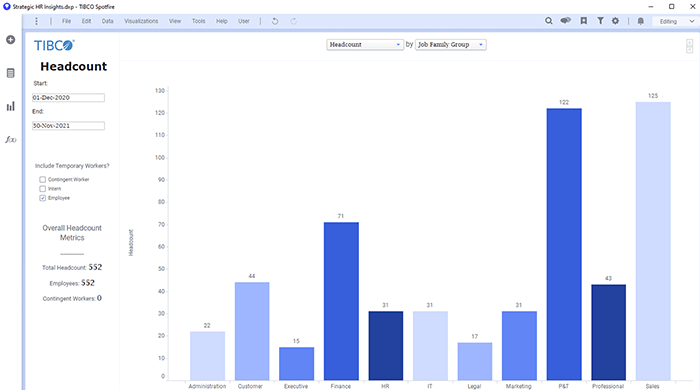
Hospitals are complex organizations to manage due to the large amount of data about patients and diverse management processes.
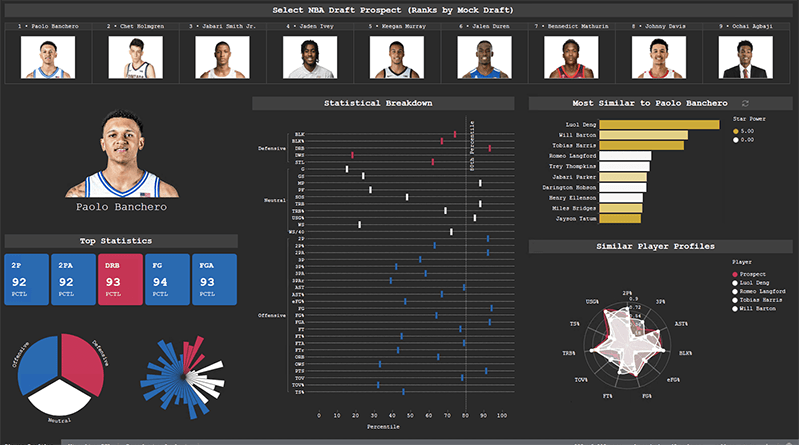
Explore prospects' strengths and find the NBA players with the most similar profiles
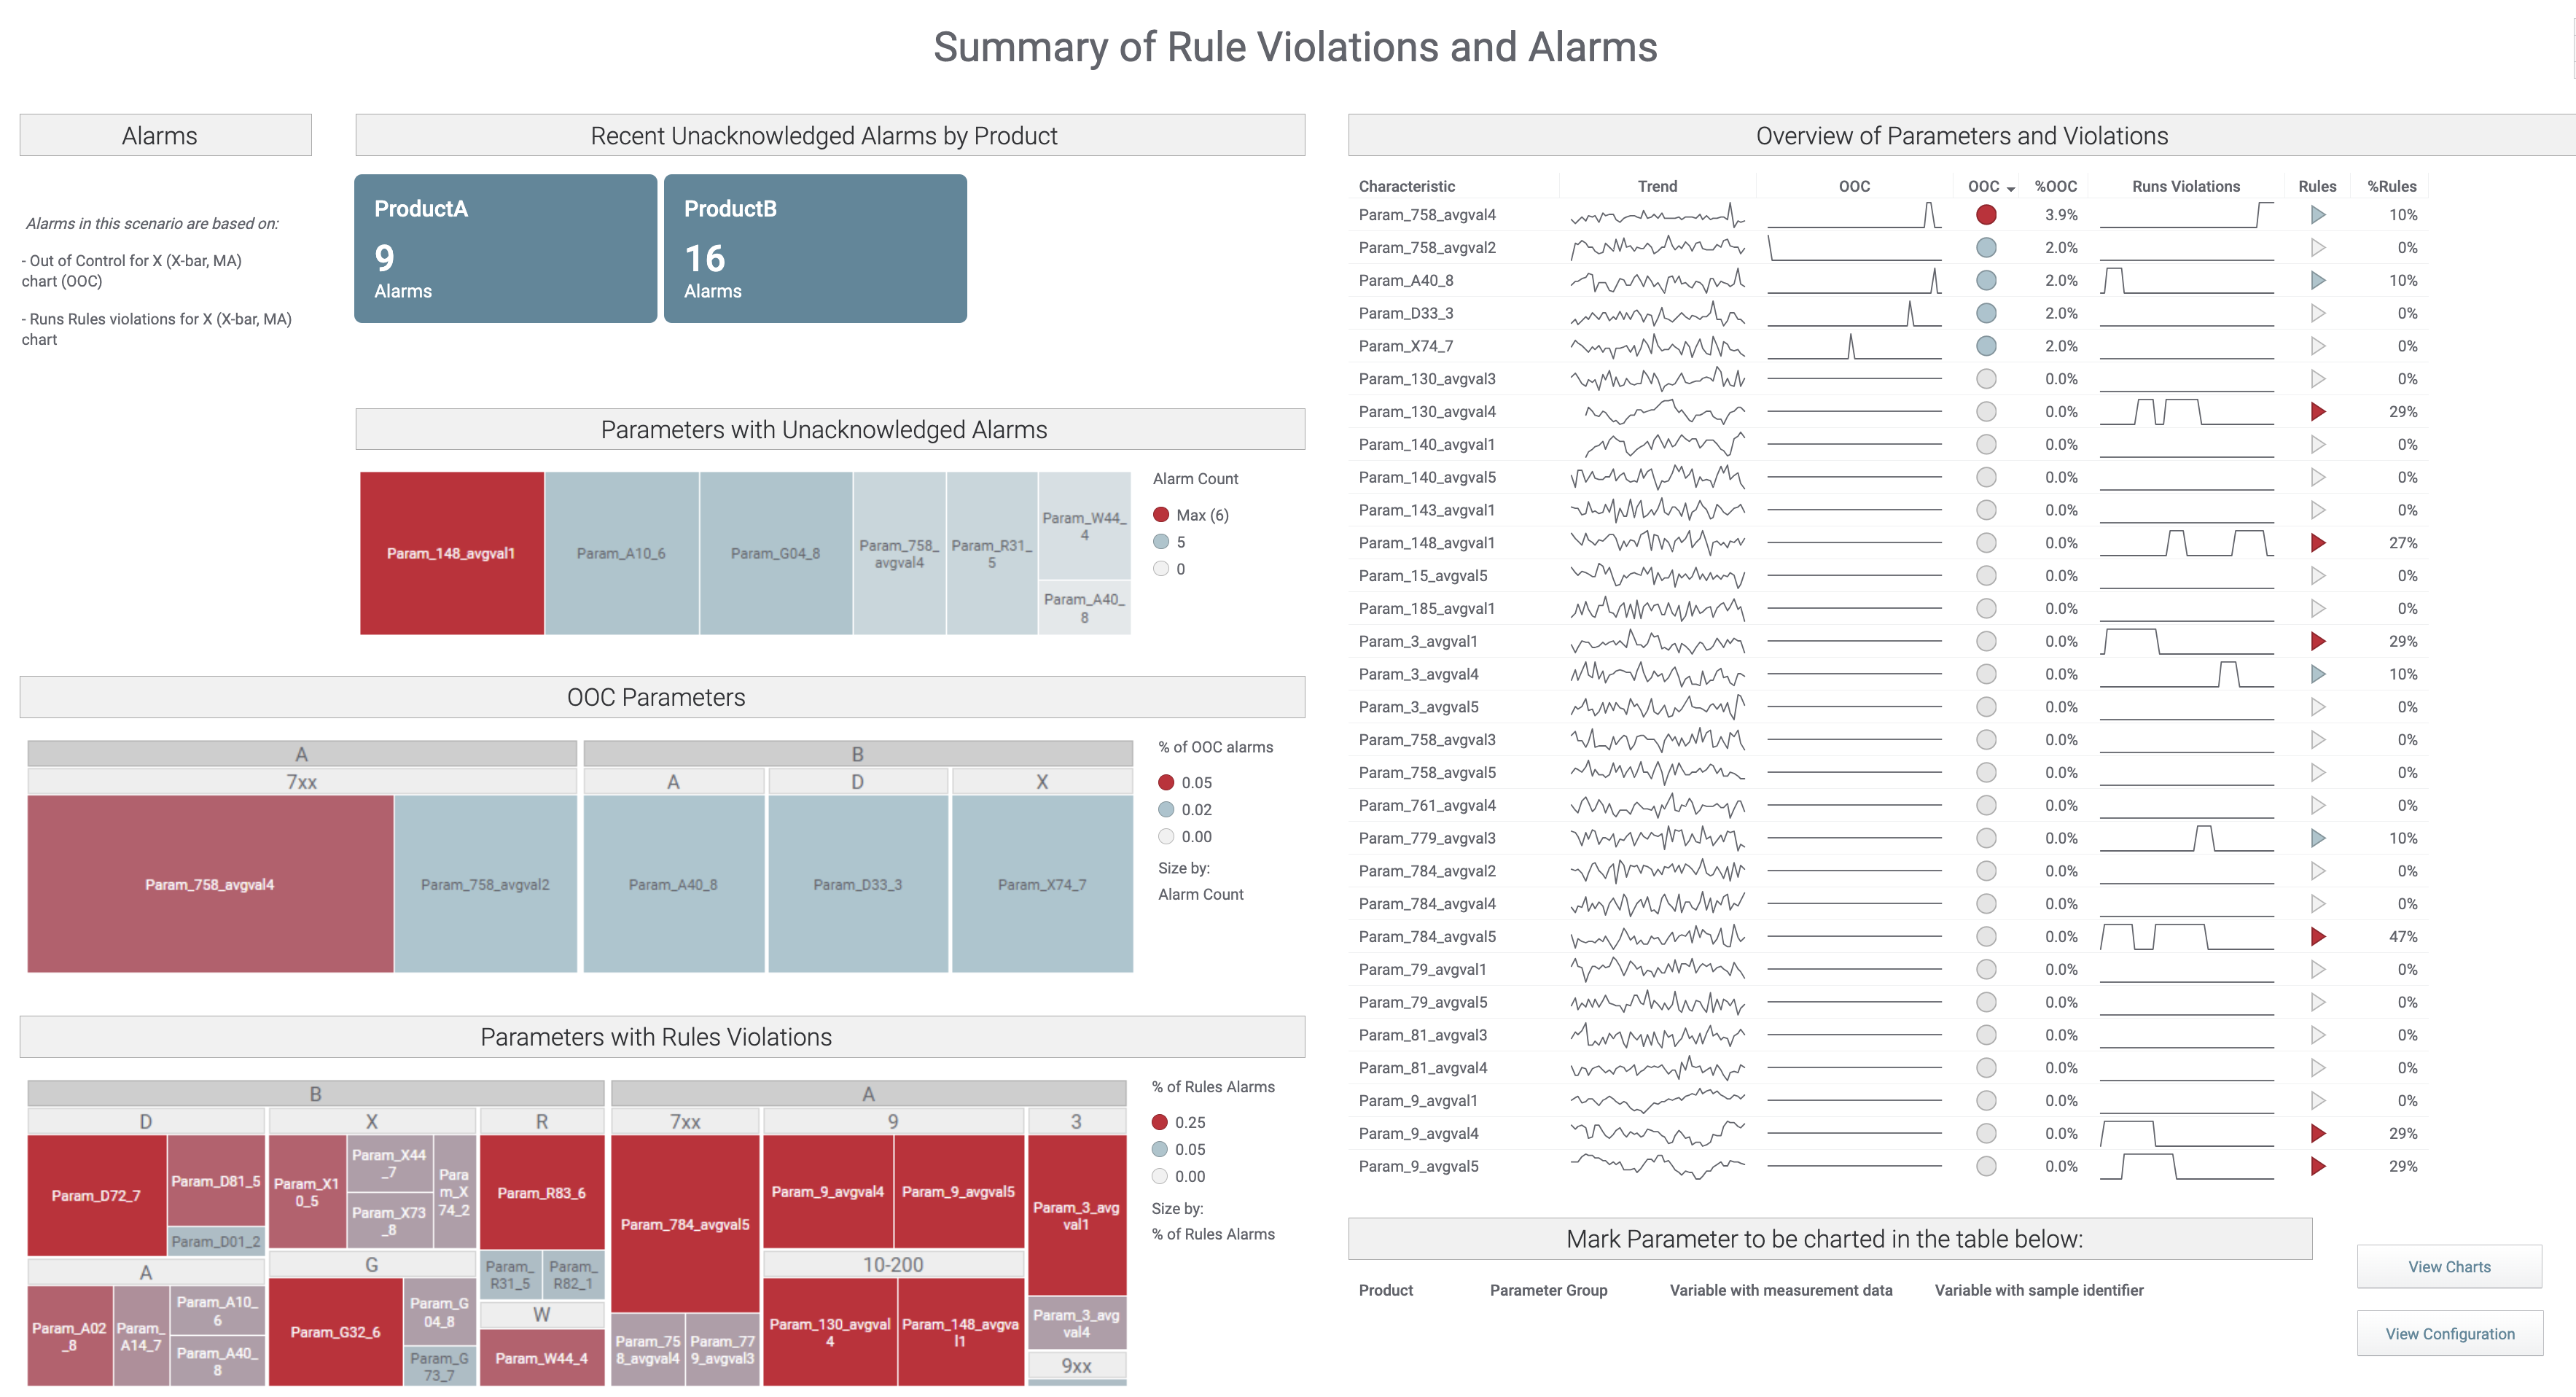
Monitor a large number of parameters leveraging Statistical Process Control
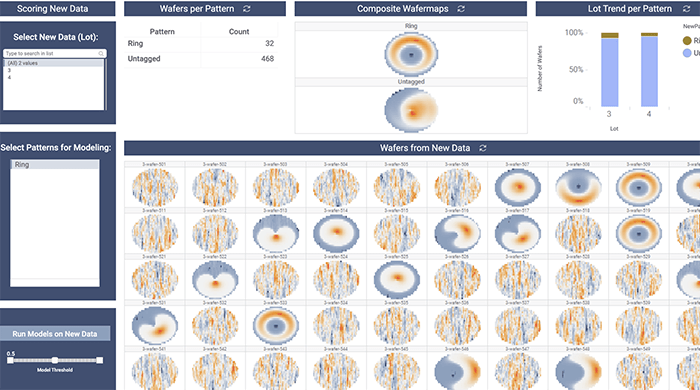
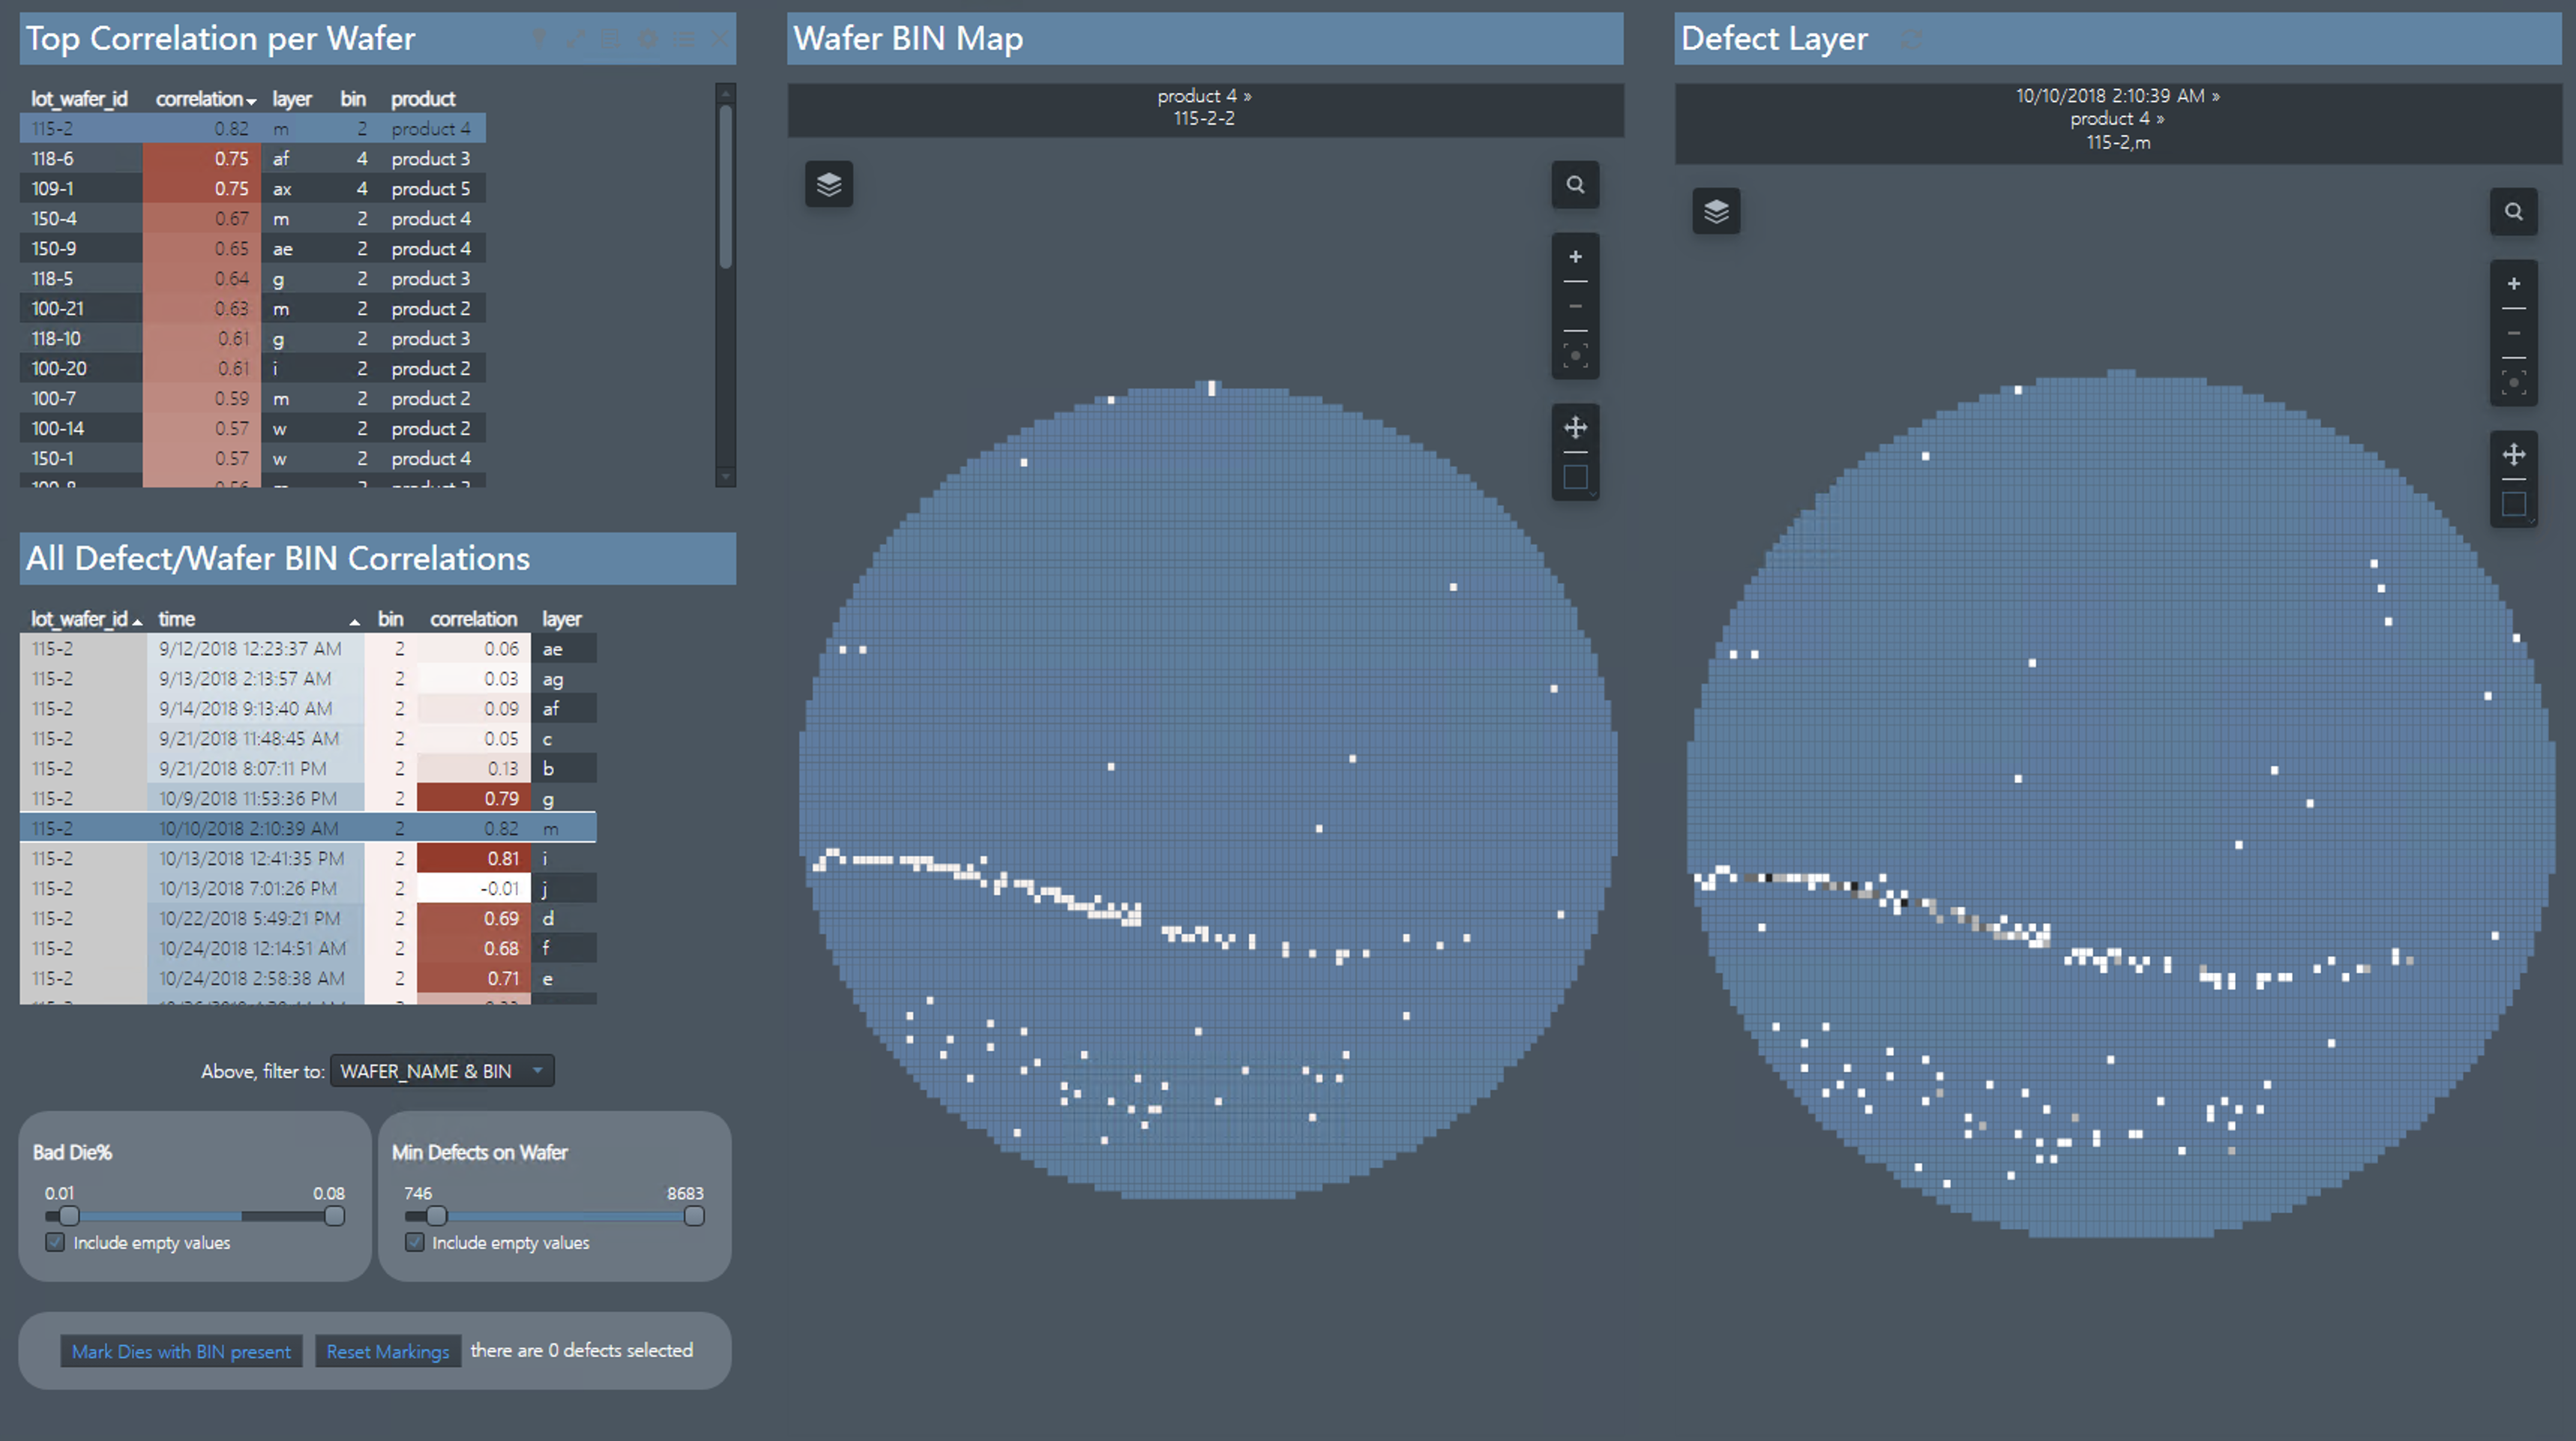
Identify composite patterns in industrial wafermaps
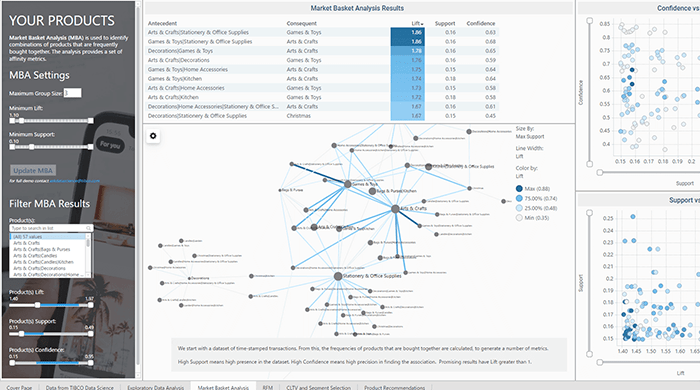
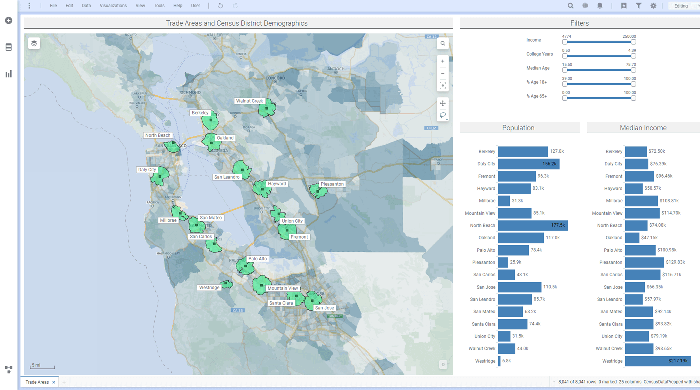
Produces actionable consumer insights using sliders, filters, and visualizations
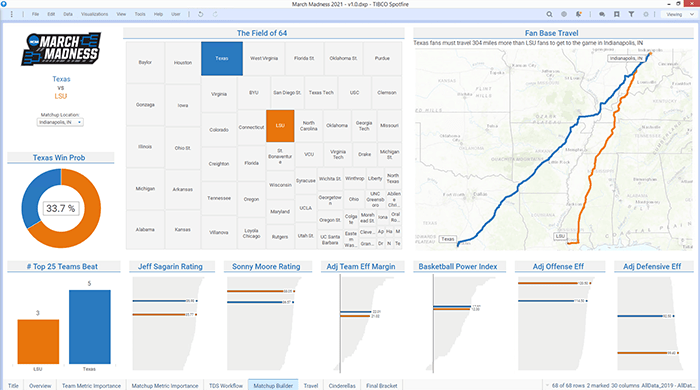
Identify top predictors, simulate potential matchups, and explore scenarios
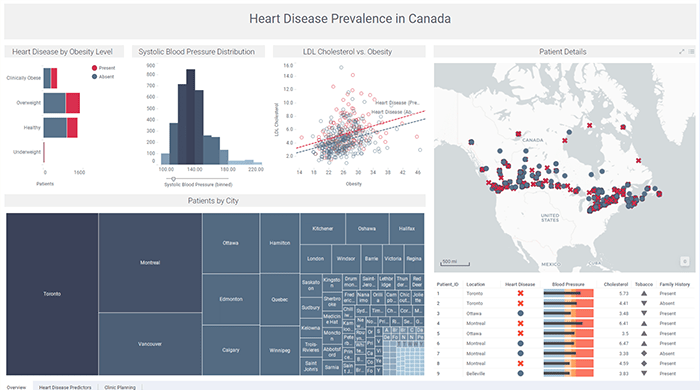
Examine patient data for heart disease and correlations with other risk factors
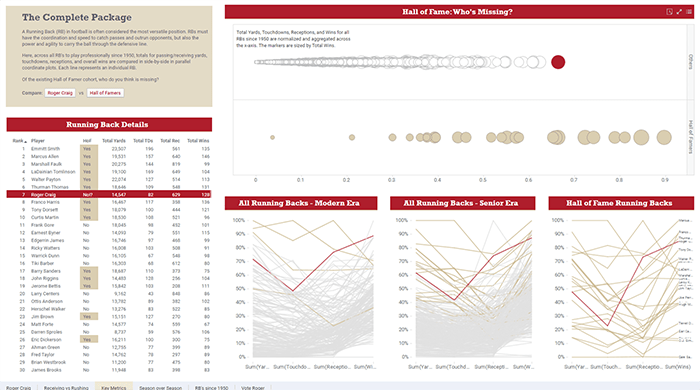
Benchmark offensive production over a historical range and compare stats
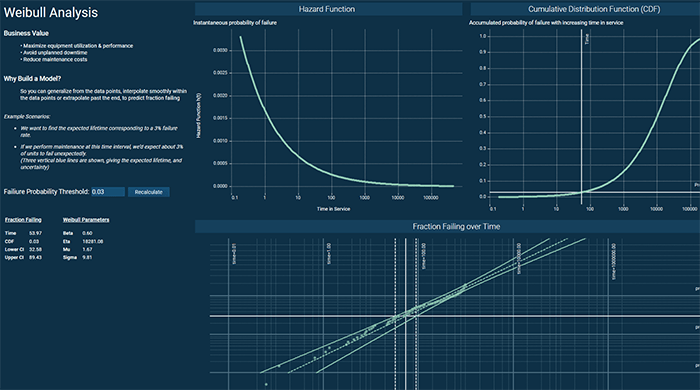
Explore a parametric failure model with a Weibull curve distribution
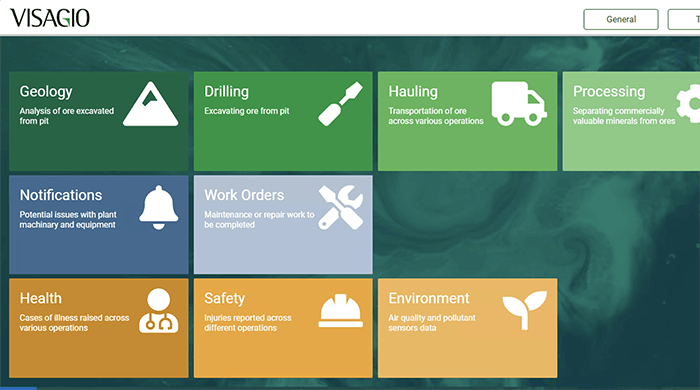
Gather and analyze data at-rest and in-motion across an end-to-end mining cycle
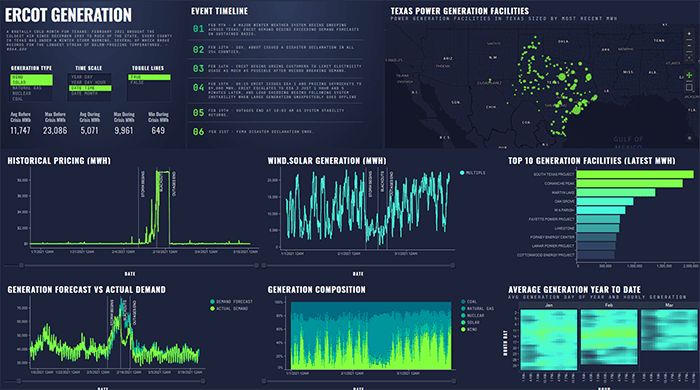
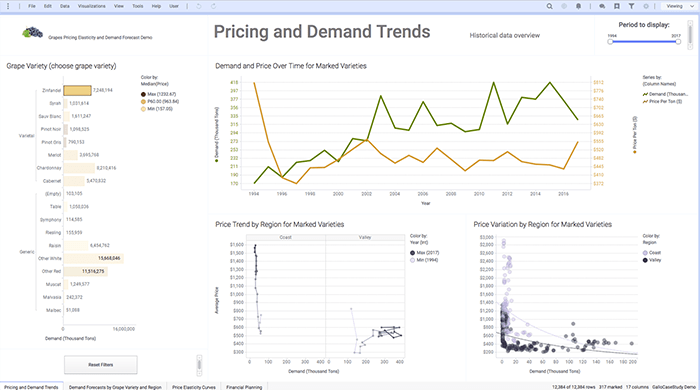
Explore energy demand and pricing with multi-layer geoanalytics drilldowns
Monitor real-time cargo unloading while recalculating route optimization

View an analysis of cycling race data and performance
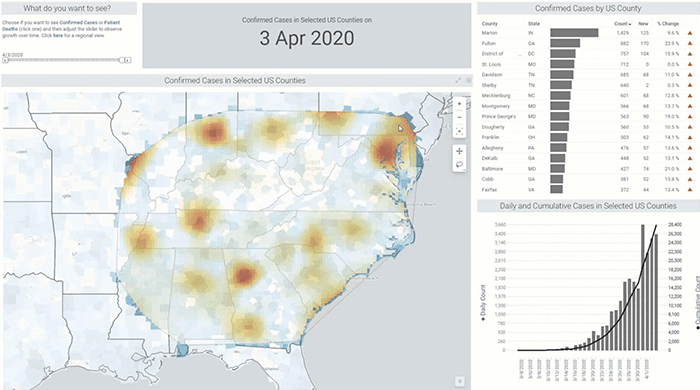
Lasso-select different US regions to find the biggest COVID outbreaks
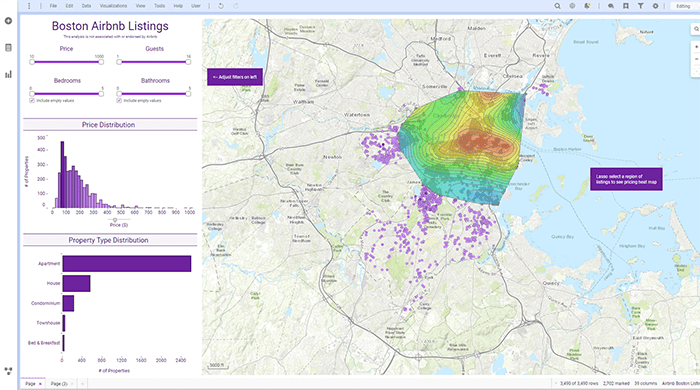
Explore property locations with dynamic filtering on an interactive map layer
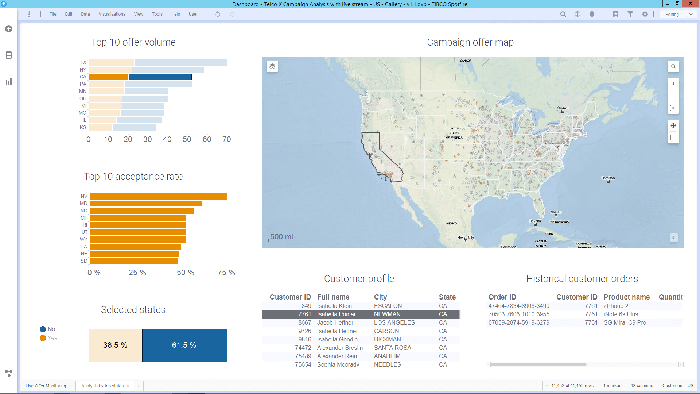
Interact with live dashboards that monitor real-time customer offers
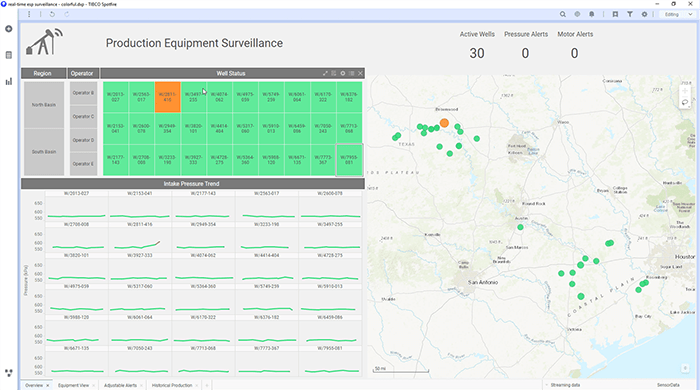
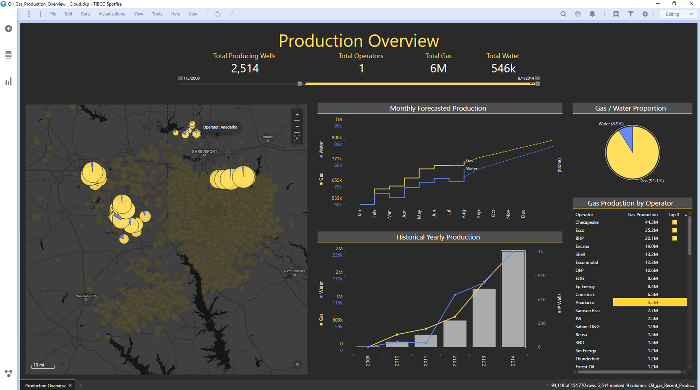
Monitor wells for pressure spikes and current drops and adjust alert settings
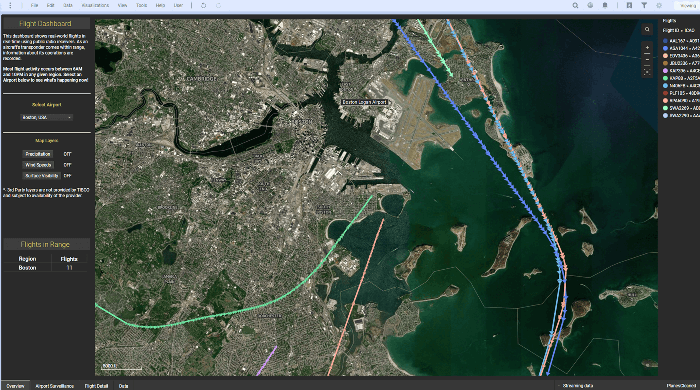
Visualize flights arriving and departing from specific airports as they occur
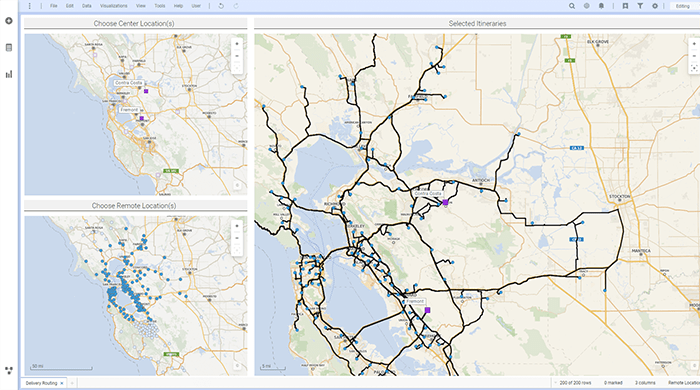
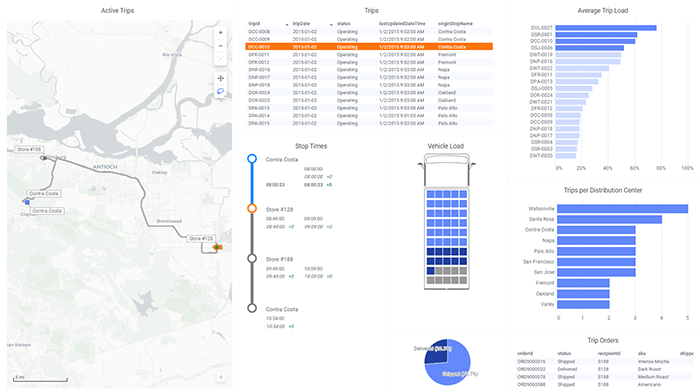
Calculate optimized driving routes between distribution and delivery
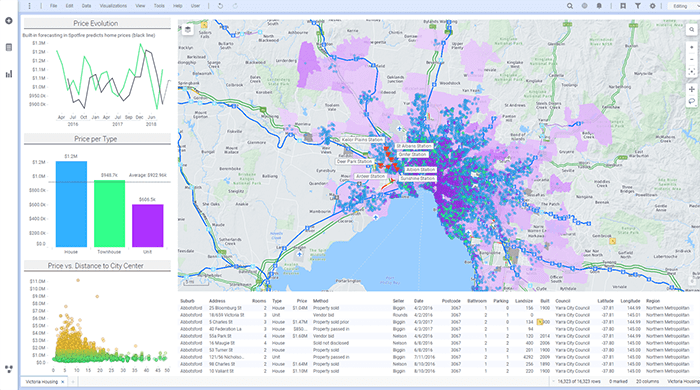
Forecast future housing prices and observe live traffic
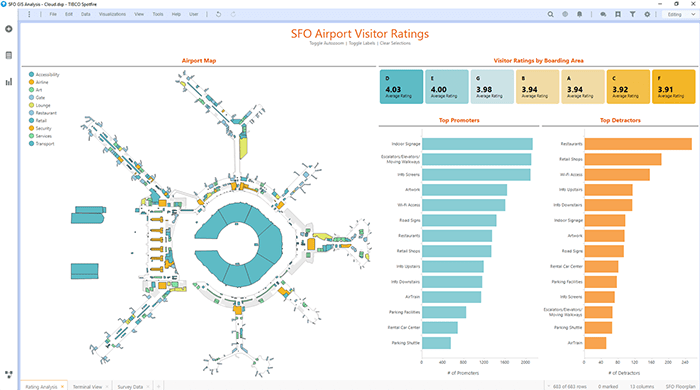
Visually explore the best and worst amenities across an airport
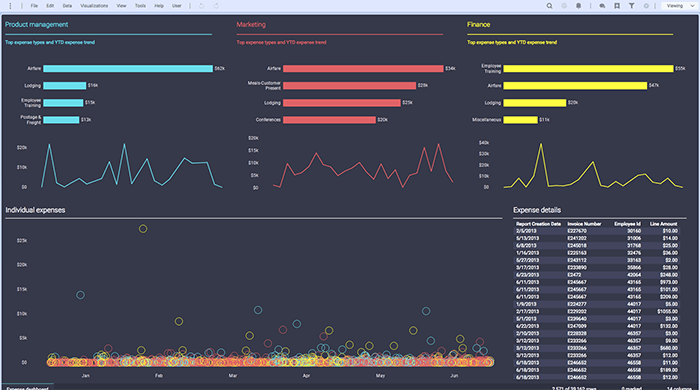
Increase revenue from product sales and reduce the costs of operations.
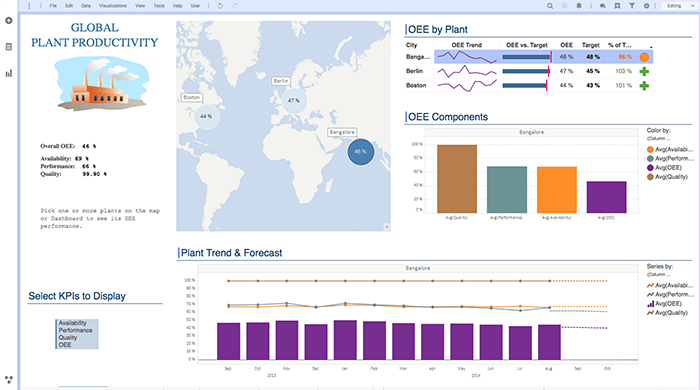
View Overall Equipment Effectiveness and minimize unscheduled downtime
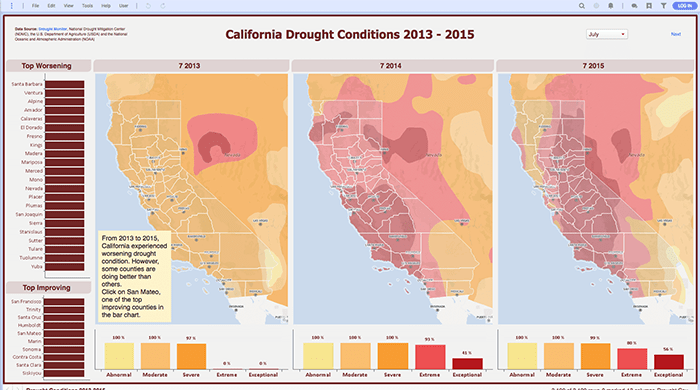
Gain deeper insights into California drought data
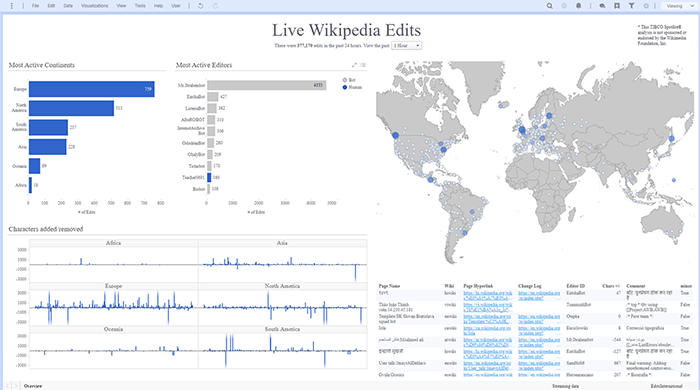
View Wikipedia edits from various countries around the world in real time
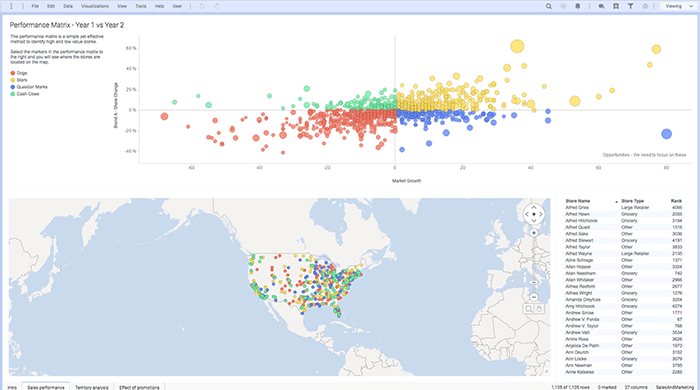
Increase market share by identifying and targeting the highest-value customers