TAF WEBINAR SERIES

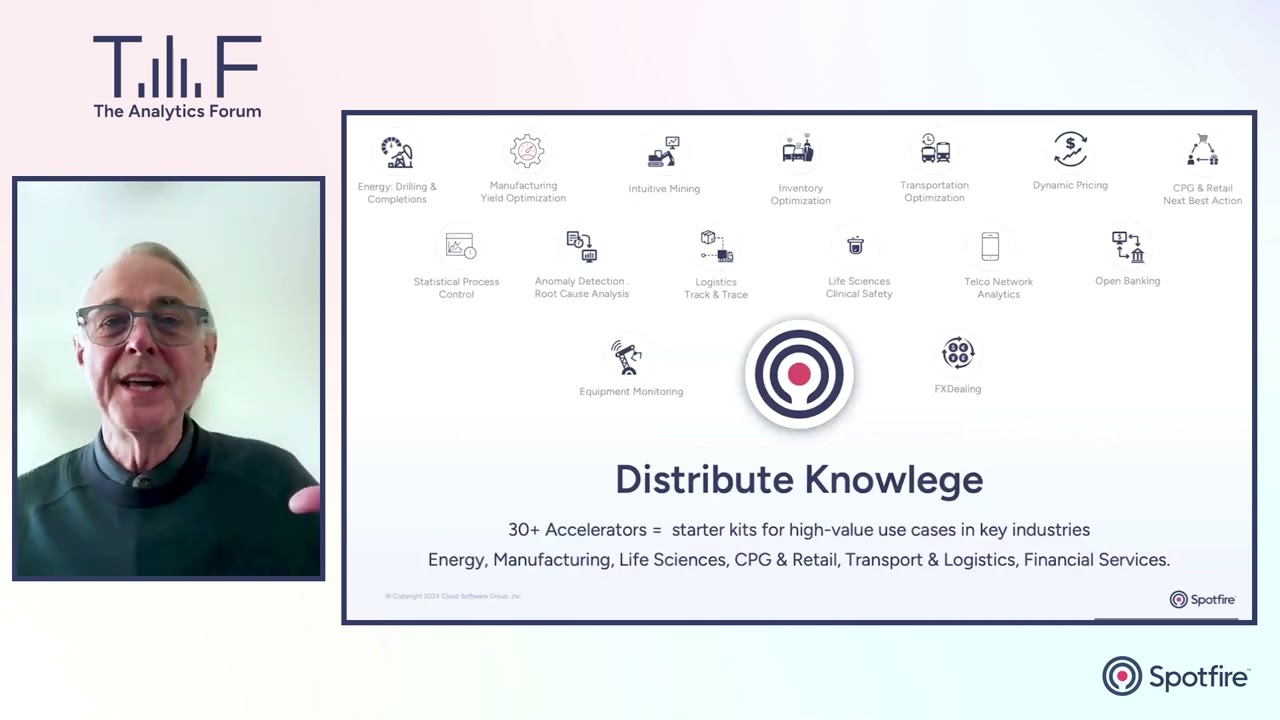
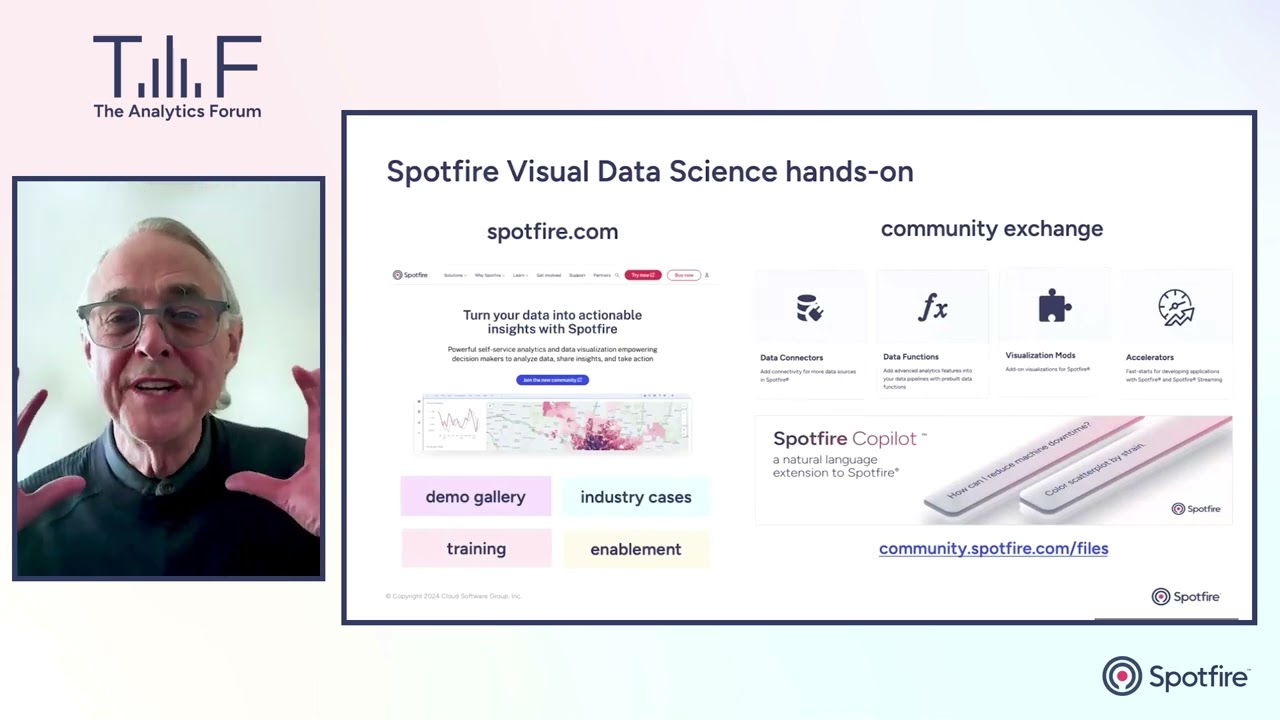
What is visual data science? An executive overview

Hear from Spotfire leadership about visual data science, a reimagined look at business intelligence fueled by predictive capabilities and real-time data. Michael O’Connell, Chief Analytics Officer, discusses how Spotfire empowers the human mind, allowing experts to solve the unsolvable. Discover the exciting possibilities for your business with the power of industry-specific visualizations combined with cutting-edge advanced analytics in the webinar below:

What is visual data science?

Visual data science overview

What is visual data science and how can it help you achieve your business goals? Watch this overview of our visual-first approach to data science and machine learning methods.

Related resources:

Visualizations in Spotfire

Spotfire has incredible Mods and Data Functions you can download and use within Spotfire. Tailor your analysis with your own custom visualizations, data functions, and much more.

Related resources:

Recent trends in AI

Generative AI is everywhere. Learn more about the Spotfire Copilot AI tool that can generate visualizations and data functions, while describing your data to users. It’s available for free download on the Spotfire Community.

Related resources:

Industry-specific applications

Spotfire excels at industry-specific data needs. Whether you’re a plant manager in high-tech manufacturing or a drilling engineer in energy—custom Spotfire analysis has got you covered.

Related resources:

Join the Spotfire Community

Spotfire is extensible and flexible to meet every business challenge. When you join our Spotfire Community, you get access to hundreds of unique solutions created by our team and other experts to create a bespoke analytics solution.

Related resources:

Visualize genius at work