Affinity analysis
Uncover trends and connections in your data and predict what will happen next
Demand forecasting
Utilize advanced analytics to predict demand, whether it stems from customer behavior or resource management
Predictive maintenance
Reduce equipment failure and resource costs by predicting breakdown and managing resources
Risk management
Provide visibility into the unknown, so you can remain diligent, decide with confidence, and keep your organization agile
Route optimization
Increase efficiency and minimize disruptions while maintaining complete view of your data
Explore unique Spotfire visualizations
Learn about the Spotfire advantage with Spotfire® extensions
Industry-specific applications and visualizations are available for free download on the Spotfire Community. You can even design your own Mods to fit your unique use cases. Check out the latest extensions now.
Interact with Spotfire use cases
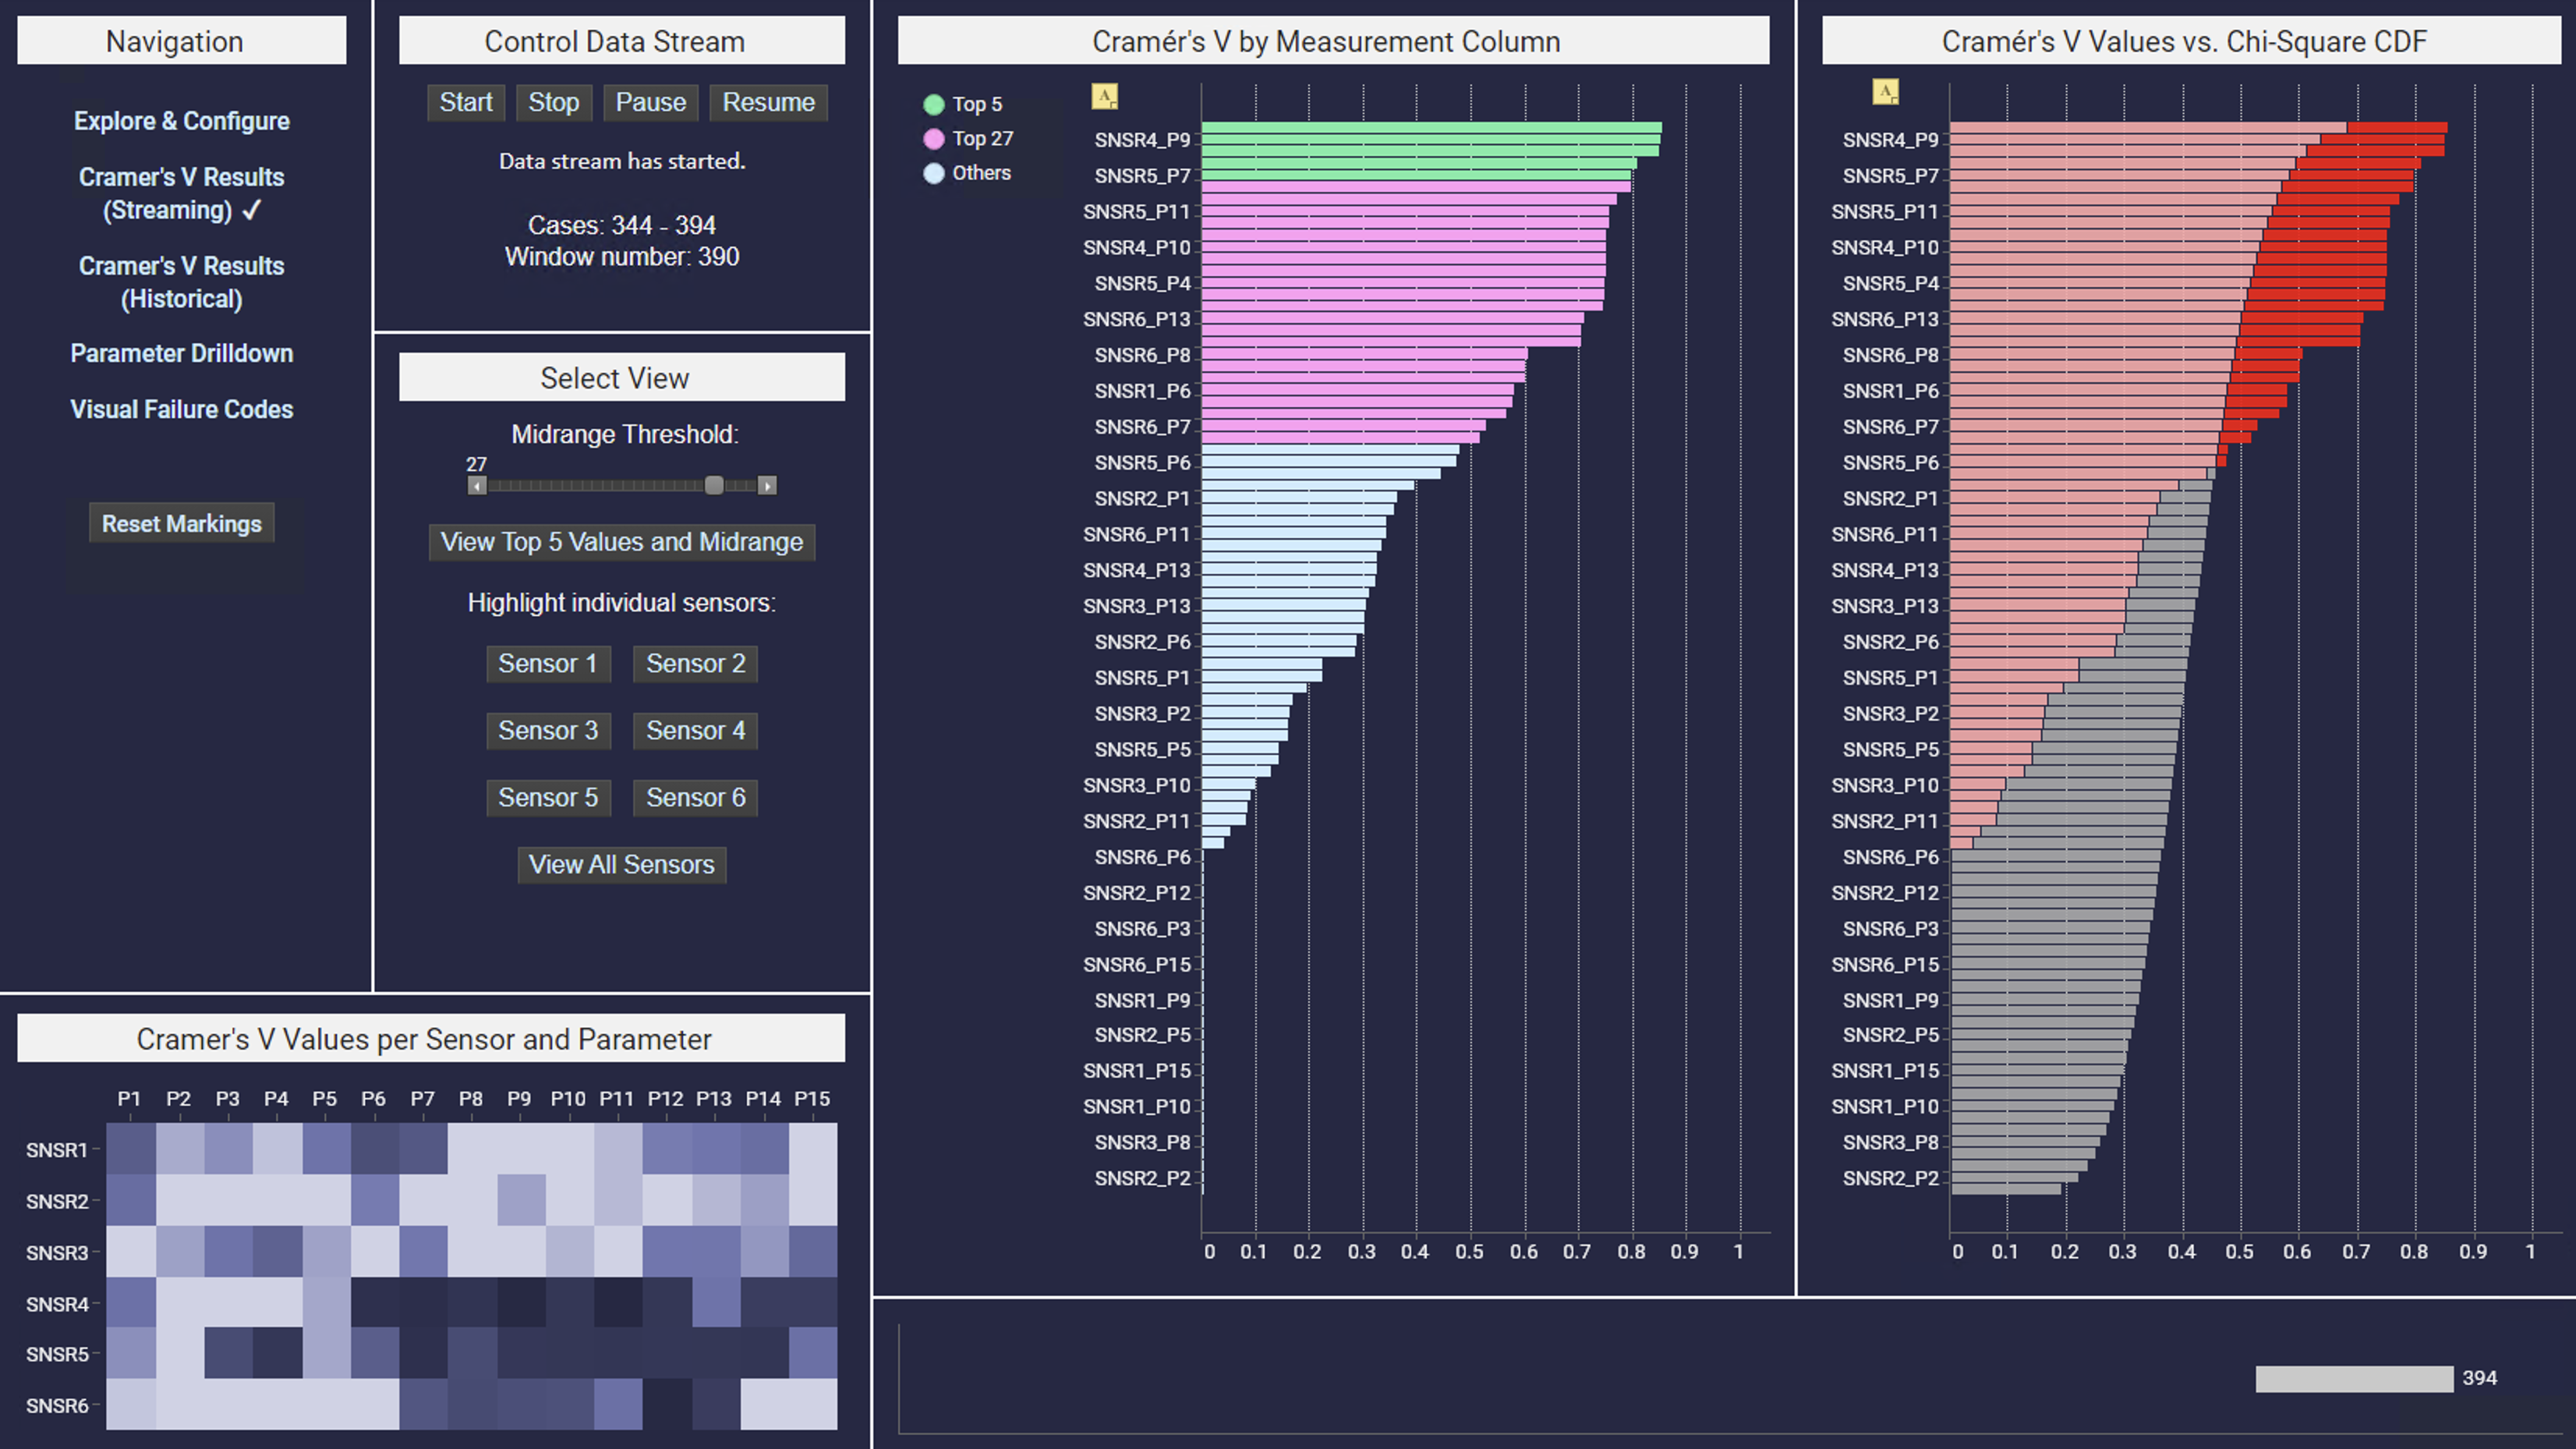
Gain guidance and direction on where to aim troubleshooting efforts in the semiconductor manufacturing process via correlation analysis performed on wafer test measurement data.
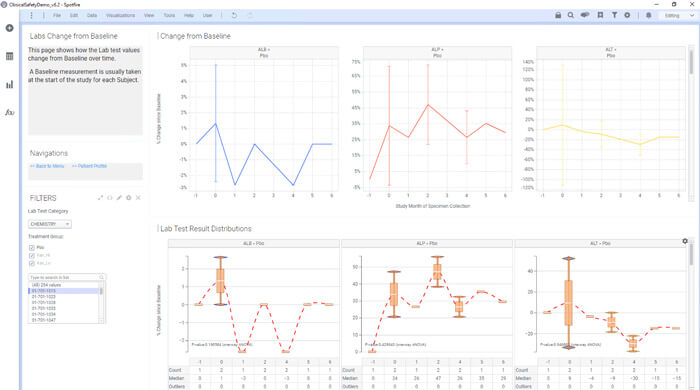
Empowers users across Clinical R&D from statisticians to site managers to analyze various aspects of patient data.
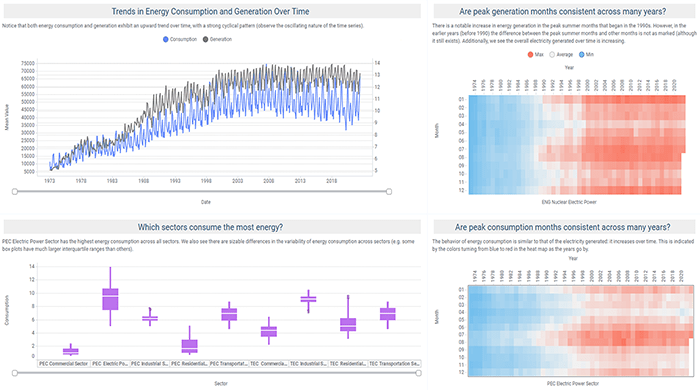
Predict future demand for energy based on historical data, environmental factors, and other relevant variables.