What is data visualization?
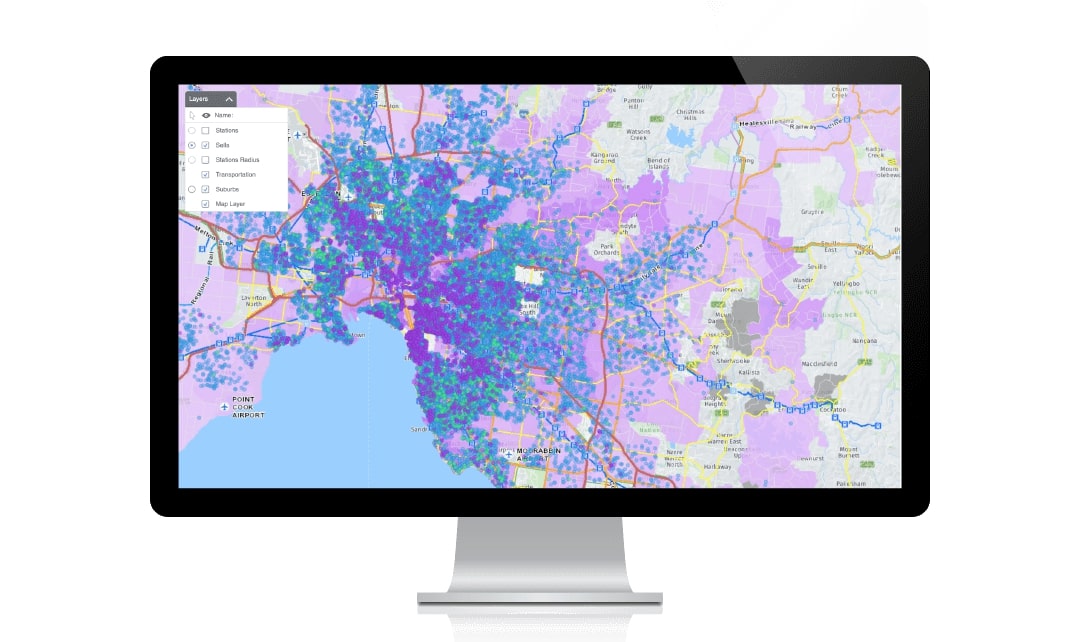
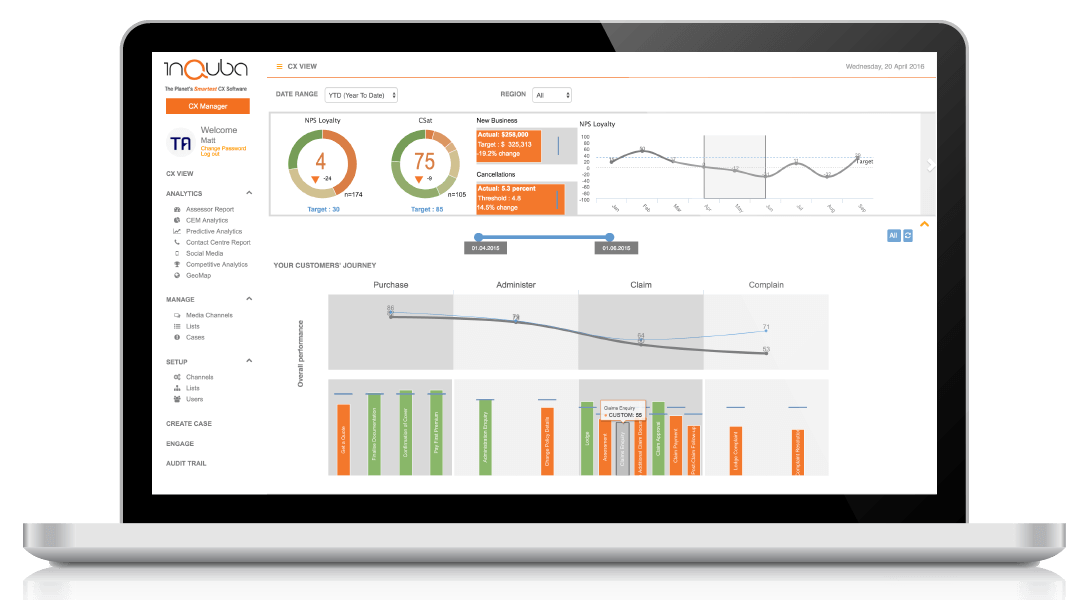
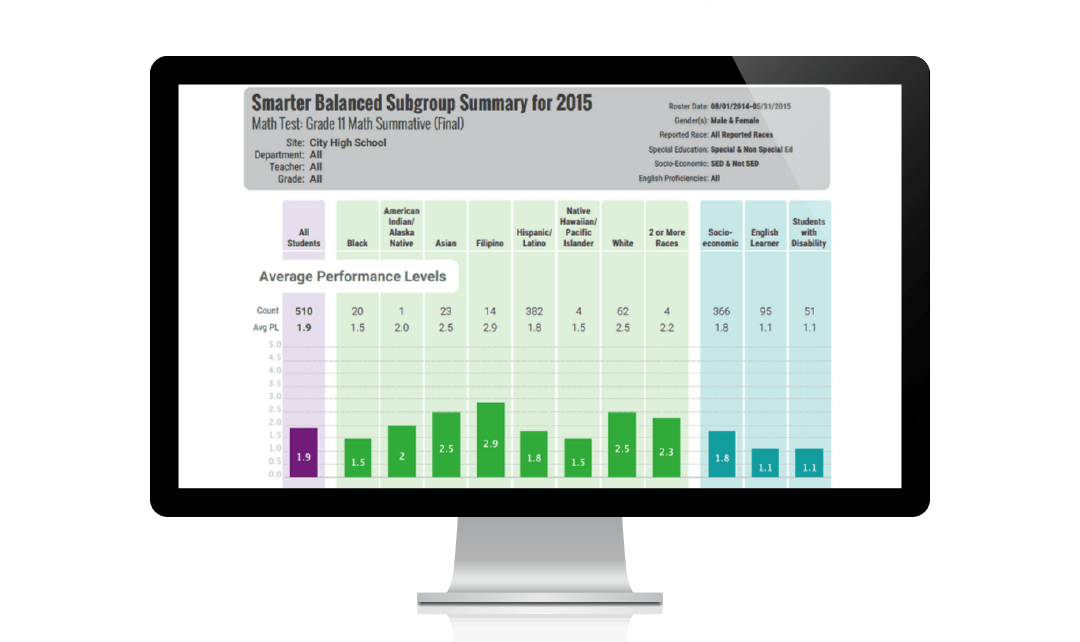
Data visualization is the graphical representation of data to help people understand context and significance. Interactive data visualization enables companies to drill down to explore details, identify patterns and outliers, and change which data is processed and/or excluded.
What does data visualization do for users?
Data visualization is very often the first step in comprehending and communicating analytics because humans are much better at understanding data when it’s presented graphically rather than numerically. When data is visualized, it’s easier to see emerging trends, which often leads to deriving insight.
As a rather intuitive format, data visualization is a powerful way to communicate a finding, allowing for easier collaboration and faster innovation. With the ubiquity of data, data visualization technology is increasing in use and proliferating across multiple disciplines.
Top 3 capabilities found in data visualization systems
Meet urgent business needs with data visualization.
Visual analytics:
AI-driven visual analytics and dashboards can be used to quickly and easily generate and deliver high-value insights. These dashboards enable everyone in your organization to use insights for better decision-making with smart data discovery, data wrangling, geospatial analytics, and one-click predictive analytics.

Embedded analytics:
Embedded analytics is the ability to deliver insights in the context that business applications, employees, and customers already use is critical. To accomplish this, the system must be able to integrate interactive reports and visualizations seamlessly into your product or service.
Enterprise reporting:
The system should modernize your enterprise reporting platform and cost-effectively deliver pixel-perfect reports. By generating reports that connect your data from multiple sources, you can deliver critical insights throughout the organization.

The benefits of data visualization
Bring insights faster
Empower everyone to transform data into insights quickly and easily. Data visualization allows easy discovery of trends and faster identification of outliers. The information helps build an understanding of how the business is performing and what opportunities and risks are developing.
Make smarter, faster decisions
Organizations can make fast data-driven decisions with visualizations that display real-time data in valuable, informative ways. By comprehending information and collaborating with others to spark insights and spot patterns in data faster, the days of relying on gut instinct to make quick decisions is long gone.

Empower everyone with advanced analytics
Now more of your organization can benefit from easy to use interactive dashboards with built-in geospatial, one-click predictive, and stream analytics to develop deeper insights, discover hidden patterns, and act on high-value business opportunities.
Improve the value of your product or service
Data holds an incredible amount of value, yet most users don’t have the time or patience to learn a specialized business intelligence tool. Make data convenient and intuitive for users by embedding analytics in their apps and business processes.
Spend less time on custom analytics requests
Save your technical teams from writing custom code for every report or visualization and from repetitive, time-intensive tasks. Instead, allow them to focus on building your core product or service by enabling end-users to visualize and get answers from data all on their own.
Types of data visualizations
General data visualizations types
- Charts
- Tables
- Graphs
- Plots
- Maps
- Infographics
- Dashboards
Specific data visualization types
- Area Chart
- Bubble Chart
- Candlestick Chart
- Column chart
- Combination Chart
- Donut Chart
- Funnel Chart
- Gantt Chart
- Gauge Chart
- Geographical Chart
- Histogram
- Kagi Chart
- Line Chart
- Logarithmic Chart
- Marimekko Chart
- Pareto Chart
- Pie Chart
- Pyramid Chart
- Radar Chart
- Scatter Chart
- Spline Chart
- Stacked Chart
- Treemap Chart
- Waterfall Chart
The best approach to data visualization
Executives of companies that invest heavily in data visualization expect results from their investment. Often times, however, the visualizations created lack value or aren’t useful for the organization. To generate valuable data visualizations, you need design thinkers, data wranglers, and subject matter experts. You cannot rely on just one person. Instead, skilled teams must be formed to present data in a more meaningful way. By connecting people with skills and tools that contribute to excellent
The impact of interactive data visualization
Interactive data visualization allows users to obtain valuable information more frequently. This helps decision-makers avoid the dangers of using hunches and guesses in time-sensitive situations. With interactive data visualization capabilities, users generate insights that drive better decisions.
Top use cases for data visualization
- Monitoring customer data
- Reviewing performance metrics
- Identifying market opportunities
- Storytelling
- Analyzing relationships
- Assessing change over time
- Trendspotting
- Comparing historical data
- Offering a comprehensive view

